Technical article
By: Taiwo Blessing olamide
INTRODUCTION
Blasting result assessment is very important to justify the efficiency and Productivity of every blasting operation. This is also to view the need to optimize the blast design in order to add value to downstream operation and reduce the cost of transporting run-off-mine, prevent transportating waste materials www the mine to the mill, minimize the cost of crushing and separating the gangue material from the concentrate in case of metallic and gemistic mining industries. It become important that analysing the blasting result using various available software that helps the mine manager to meet up with the production rate per day at the lowest cost implication is imperative. Most mines are less concerned about the result of Blasting but still keep complaining on the low profitability of their mine and low efficiency of the working equipments. Poor loading with long loading cycle time along side with continuous separation of Boulders consume Diesel and also limit the loading equipment efficiency.

Some mine employs the use of hydraulic breaker for further breaking of boulders separated from poor blasting, while others industry engage in secondary Blasting operation. Blasting operation can be done in such as to limit secondary fragmentation cost through justification of blast output result and checking the status of each blast result to optimize the blast parameters such as to produce result that blend with the gape of the primary crusher.
This makes blast Fragmentation analysis and other Post blast checking softwares like WipFrag software, Split desktop, Fraglist software among others Important.
Nevertheless the use of o-pit blast software, Kuz-Ram model in adjusting the blast design is also important.
Find below a simple and Introduction explanation to Blast result analysis.
BRIEF INTRODUCTION ABOUT WIPFRAG SOFTWARE

WipFrag analysis is one of the many available software use in analysing blast Fragmentation. Mostly, after Blasting, the Mining Engineers are interested in checking the Blasting aggregate uniformity and size distribution which help both in measuring the blast efficiency and the digging rate of loading equipment during loading. It is believed that, a good Blasting is that which has <5% oversize and <5%undersize.
Also, from the result of fragmentation analysis, we can determine whether their is blast misfire or improper detonation of explosive charge which can be detrimental to both mine workers and loading equipment. This makes fragmentation analysis very important.
WipFrag software make use of empirical model and other intrinsic model to justify blasting image from the view of photo analysis.
The software recieve blast picture snapped with a scaling object and provides the size distribution graph for a typical Blasting.
The software base on it design program consist of image analysis program code which by scanning, generates an image size distribution which is justified by the scaling object provided in the picture.
HOW DOES WIPFRAG SOFTWARE WORKS
Getting blast image from the mine site is the first thing to do.
The image is collected with either phone camera or drone as shown below

After Blasting, excavator can be use to spread the muckpile in case of heap pile.
Then a scaling object is placed on the blast pile.
The scaling object can be helmet, frame of known dimension or any object with define dimension.
In snapping the picture, the angle at which the picture is been snapped is very important, likewise the distance. The distance must not be to far and also the camera inclination must not be to dip in.
After collection of blast images,
The image is uploaded into the software.
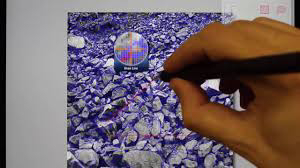
The scaling object dimension is imputed.
Then, the scaling object image dimension is measure with an inbuilt dimensioning ruler provided by the software. See the image below
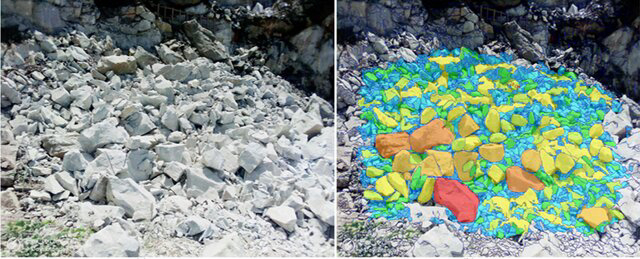
After this, the mesh scan of the image particle size is adjust to fit in for both large boulder and fine particles. After particle mesh adjustment had been done, the graph for the size distribution is generated automatically.
Interpretation of the graph
As have said earlier, blasting Engineers are concerned with the improvement in productivity of the mine.. therefore analysing the size distribution to know if the undersize produce is to much or the oversize is to much is done on the particle size distribution graph.
The provided graph is like this shown below,

The graph gives the particle size range and their percentage in the pile. The software also provide data like the 50% passing size and other information about the blast.
The X50 denotes the Fragment size that make up the 50% material passing opening in the blast result.
The X80 represent the Fragment size that make up the 80% material passing opening in the blast result.
The graph interpretation is also display at the right hand side in tabular form.
This result provides other parameters such as uniformity index, Xmax, X10 to mention few.
CONCLUSION
Using analysis software will not only provide you with data to work with, it will also help you to make necessary adjustments to your blast design and output.


